Ethereum Price Analysis: Can ETH Bounce Back Before $1.5K Comes Into Play?
TL;DR
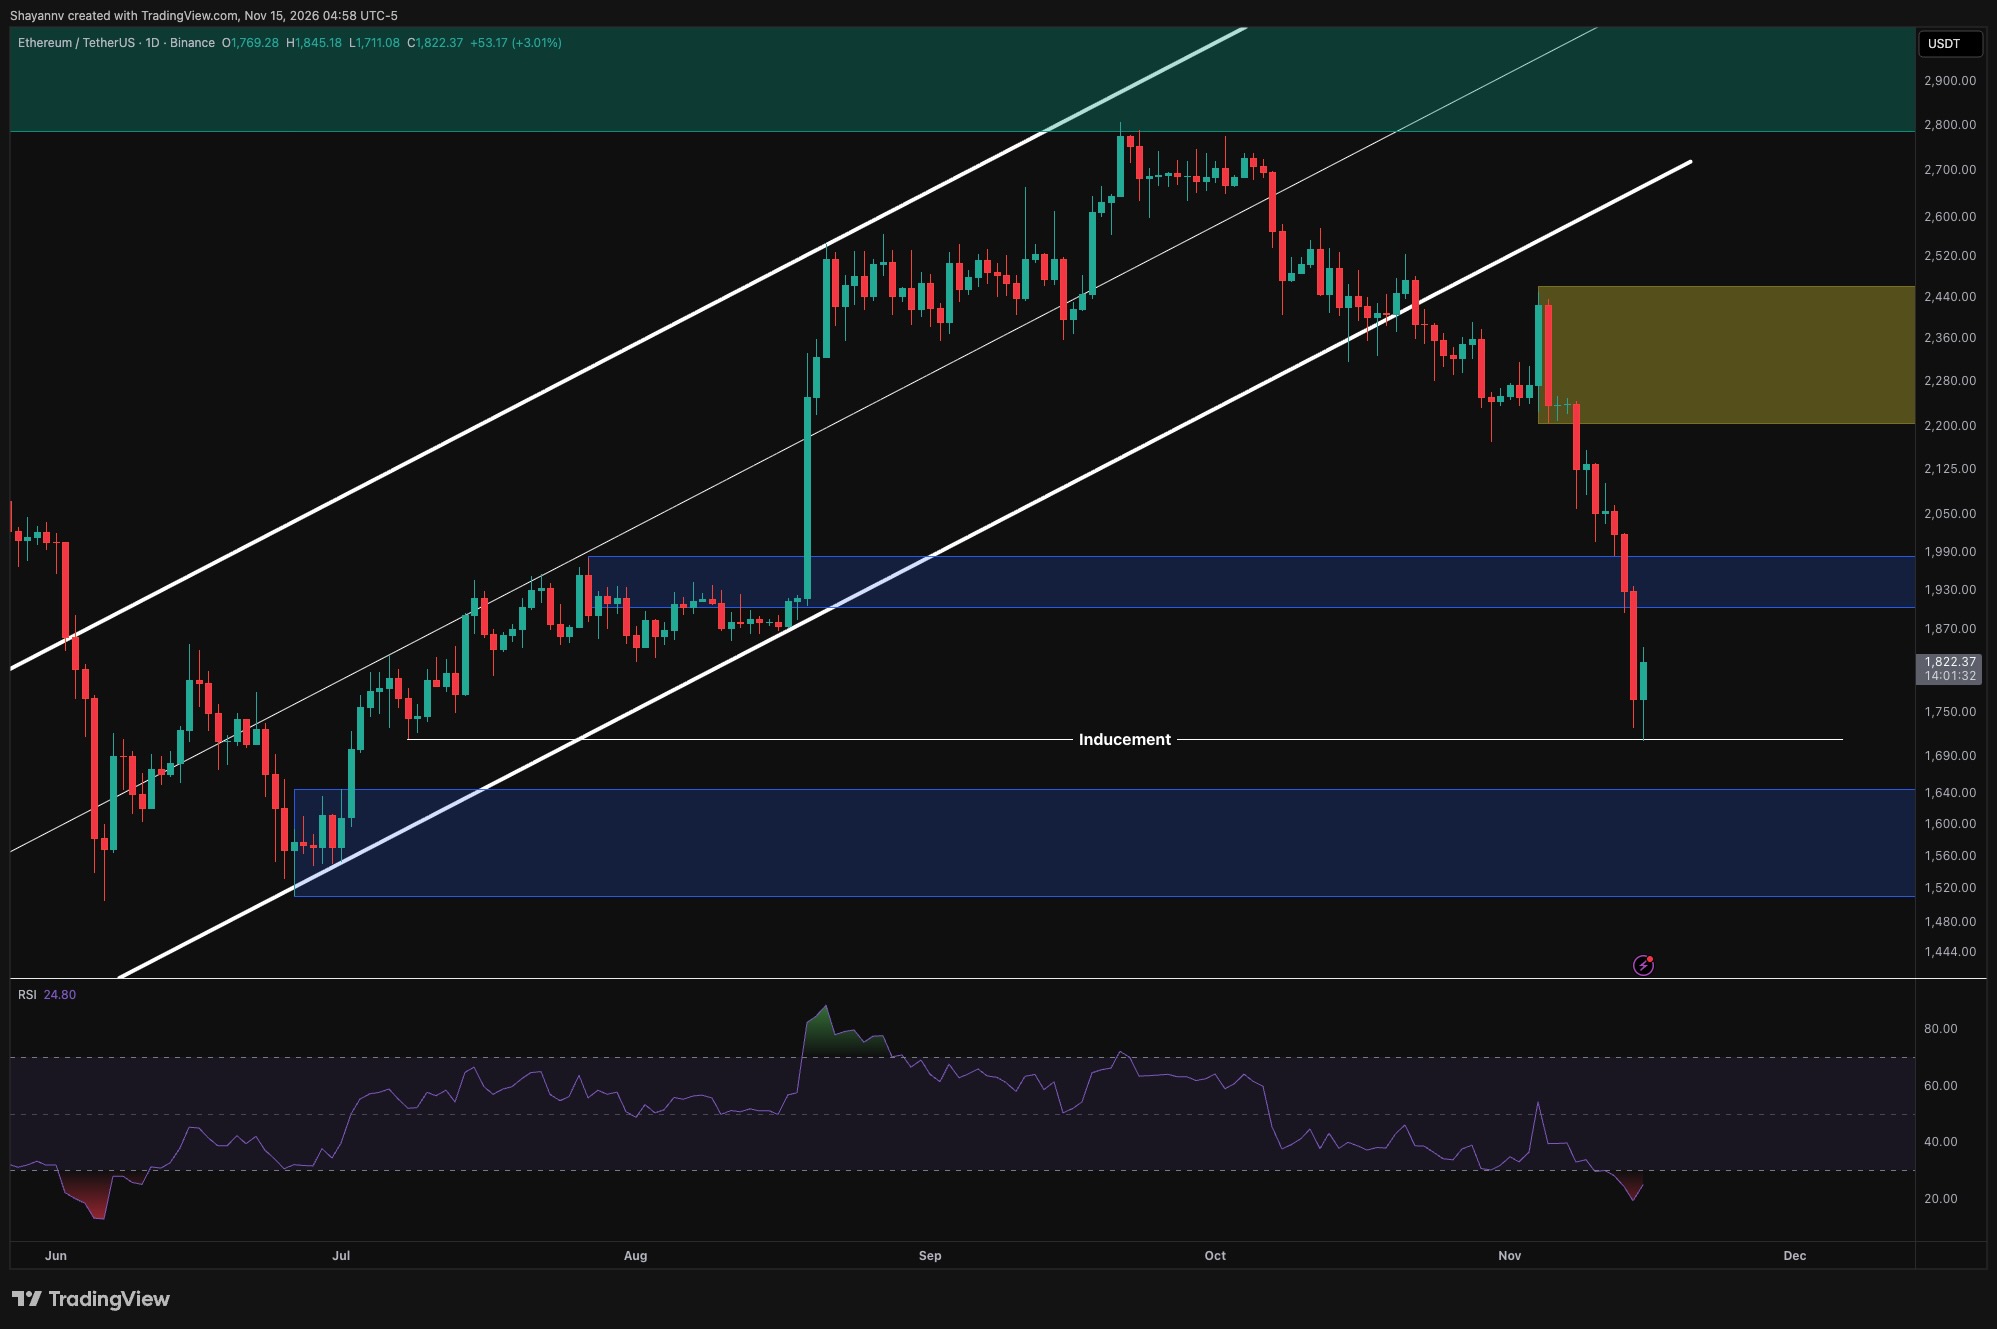
- Ethereum has rebounded toward $1.82K after a sharp selloff reached the marked liquidity level near $1.71K.
- The daily chart shows ETH extending its decline beneath the former $1.90K–$1.98K demand zone.
- Sentiment Analysis The Futures Average Order Size chart shows a recent cluster classified as big whale orders accompanying Ethereum’s decline from above $2.2K toward the $1.8K region.
Ethereum has rebounded toward $1.82K after a sharp selloff reached the marked liquidity level near $1.71K. Daily momentum is oversold, creating room for a relief rally, but the broader bearish structure remains intact as large futures orders appear during the decline. Ethereum Price Analysis: The Daily Chart The daily chart shows ETH extending its decline beneath the former $1.90K–$1.98K demand zone. Losing this base accelerated selling toward the horizontal level marked as inducement around $1.71K, where the latest candle has attracted a buying response. The daily RSI sits near 25, indicatin…
Read the full story at CryptoPotato →
Coins mentioned