Ripple Price Analysis: Is the Worst Yet to Come as XRP Dumps to a 2-Year Low?
TL;DR
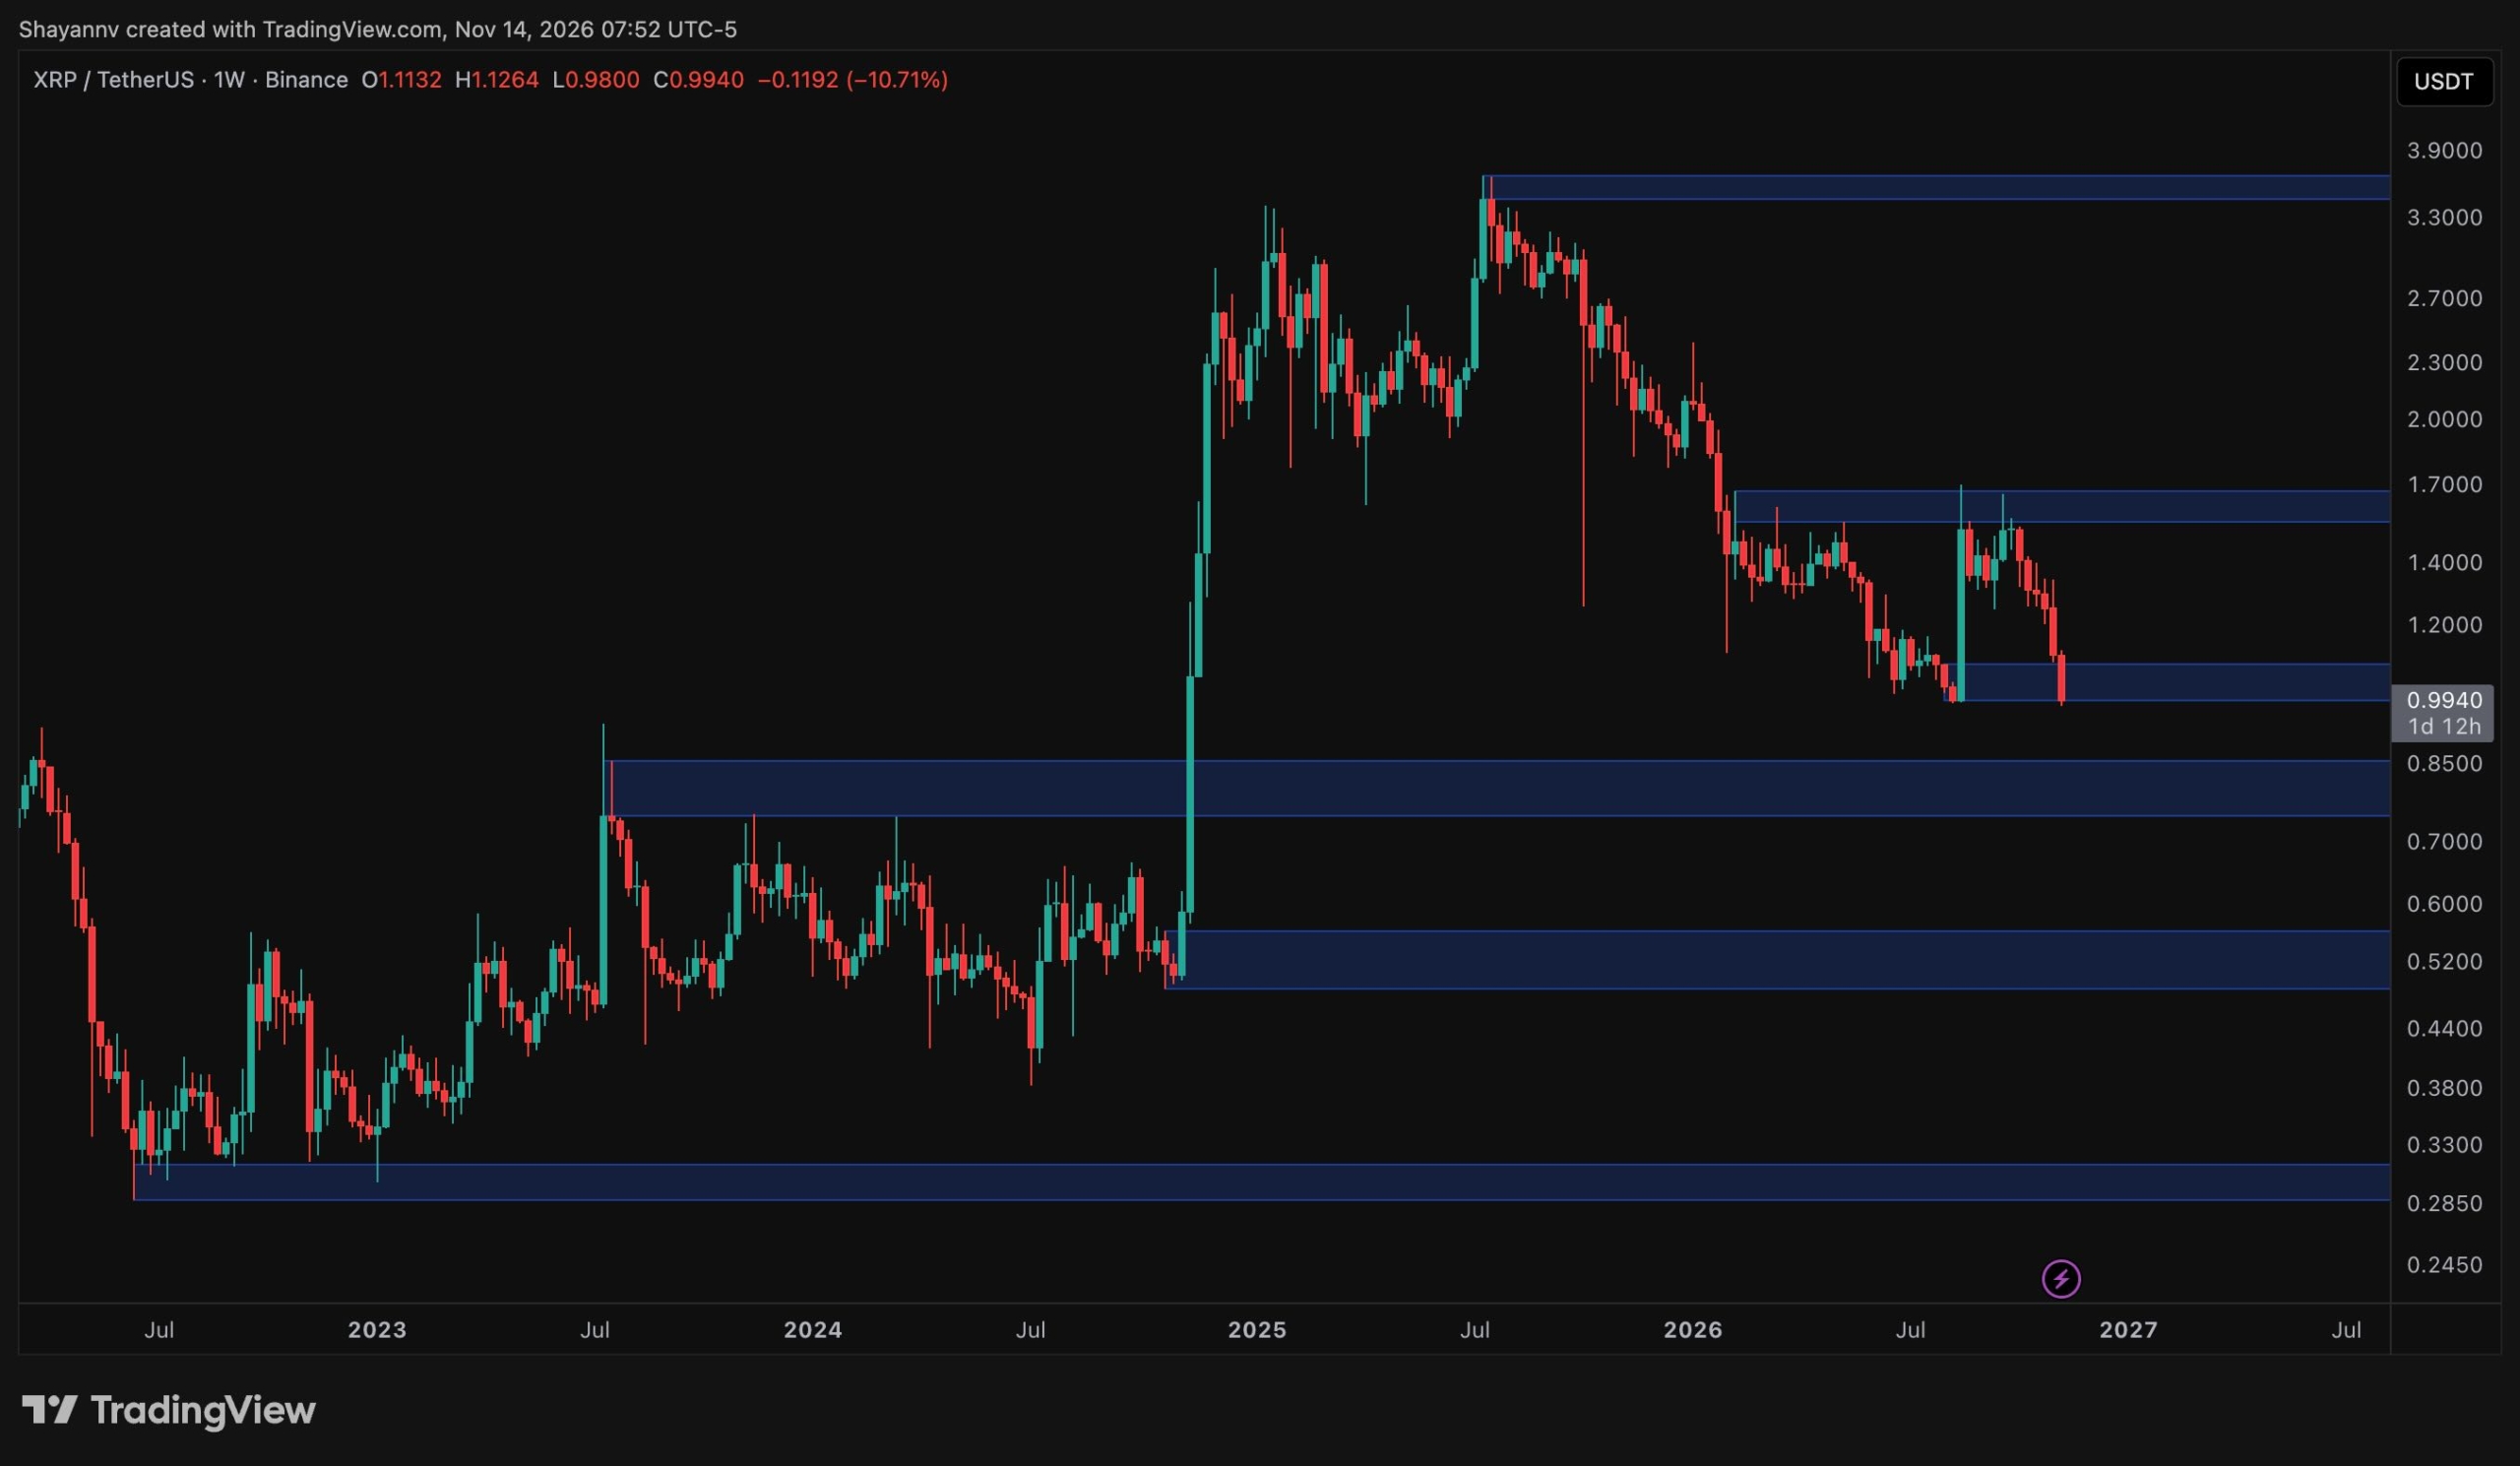
- XRP has extended its November sell-off, falling more than 10% this week and dropping below the $1.00 mark.
- The weekly chart shows XRP in a broad bearish structure since it peaked near $3.65 in July 2025, with a clear sequence of lower highs and lower lows.
- The August 2026 rally from $1.00 briefly lifted the price into the $1.60 resistance zone.
XRP has extended its November sell-off, falling more than 10% this week and dropping below the $1.00 mark. Trading beneath that key level, the asset is now testing the same support that launched its August rally, which makes the current zone a key inflection point for the broader trend. Ripple Price Analysis: Weekly Timeframe The weekly chart shows XRP in a broad bearish structure since it peaked near $3.65 in July 2025, with a clear sequence of lower highs and lower lows. The August 2026 rally from $1.00 briefly lifted the price into the $1.60 resistance zone. However, two rejections from th…
Read the full story at CryptoPotato →
Coins mentioned
Coin categories